Easy thresh
- CPAC.easy_thresh.copy_geom(infile_a, infile_b)[source]
Method to call fsl fslcpgeom command to copy certain parts of the header information (image dimensions, voxel dimensions, voxel dimensions units string, image orientation/origin or qform/sform info) from one image to another
- Parameters:
- infile_anifti file
input volume from which the geometry is copied from
- infile_bnifti file
input volume from which the geometry is copied to
- Returns:
- out_filenifti file
Input volume infile_b with modified geometry information in the header.
- Raises:
- Exception
If fslcpgeom fails
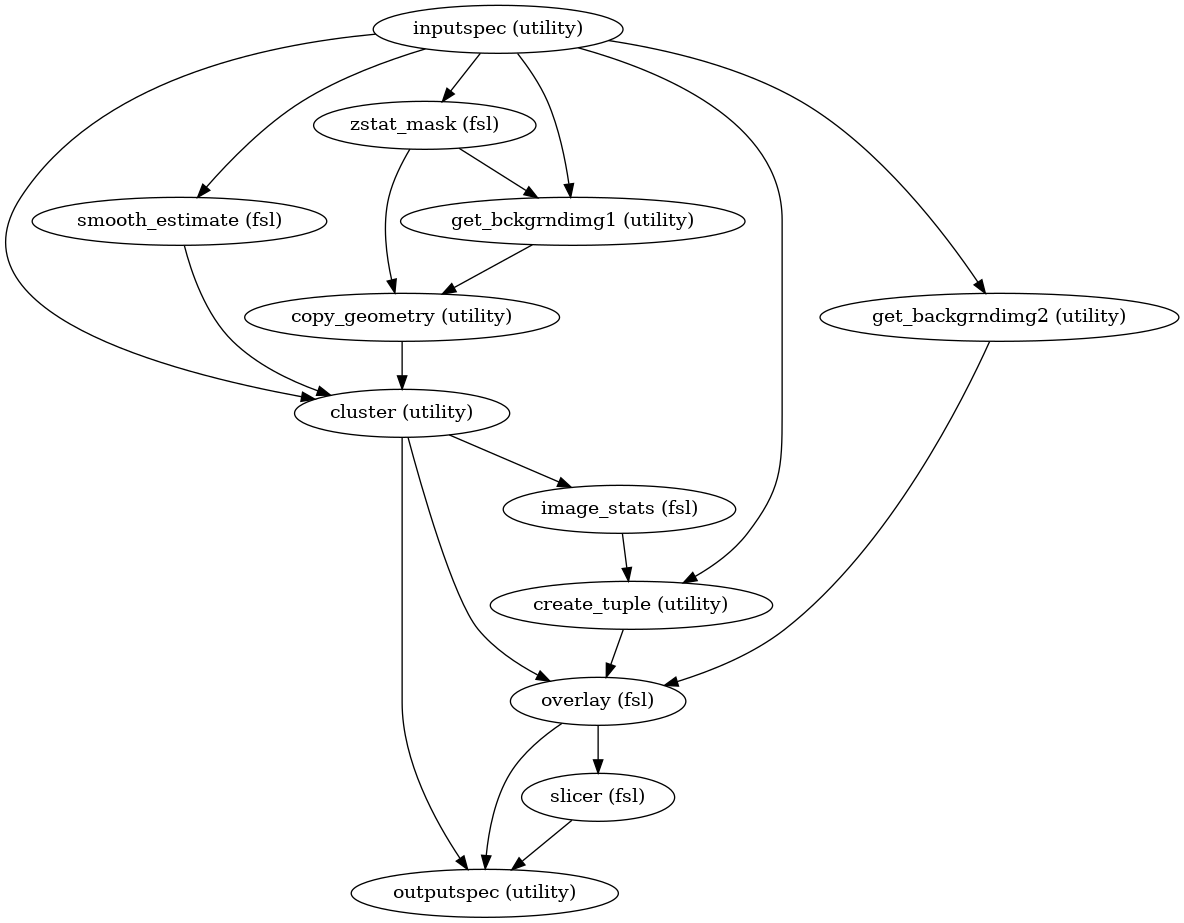
- CPAC.easy_thresh.easy_thresh(wf_name)[source]
Workflow for carrying out cluster-based thresholding and colour activation overlaying
- Parameters:
- wf_namestring
Workflow name
- Returns:
- easy_threshobject
Easy thresh workflow object
Notes
Workflow Inputs:
inputspec.z_stats : string (nifti file)
    z_score stats output for t or f contrast from flameo

inputspec.merge_mask : string (nifti file)
    mask generated from 4D Merged derivative file

inputspec.z_threshold : float
    Z Statistic threshold value for cluster thresholding. It is used to
    determine what level of activation would be statistically significant.
    Increasing this will result in higher estimates of required effect.

inputspec.p_threshold : float
    Probability threshold for cluster thresholding.

inputspec.paramerters : string (tuple)
    tuple containing which MNI and FSLDIR path information
Workflow Outputs:
outputspec.cluster_threshold : string (nifti files)
   the thresholded Z statistic image for each t contrast

outputspec.cluster_index : string (nifti files)
    image of clusters for each t contrast; the values
    in the clusters are the index numbers as used
    in the cluster list.

outputspec.overlay_threshold : string (nifti files)
    3D color rendered stats overlay image for t contrast
    After reloading this image, use the Statistics Color
    Rendering GUI to reload the color look-up-table

outputspec.overlay_rendered_image : string (nifti files)
   2D color rendered stats overlay picture for each t contrast

outputspec.cluster_localmax_txt : string (text files)
    local maxima text file, defines the coordinates of maximum value
    in the cluster
Order of commands:
Estimate smoothness of the image:
smoothest --mask= merge_mask.nii.gz --zstat=.../flameo/stats/zstat1.nii.gz

arguments
--mask  :  brain mask volume
--zstat :  filename of zstat/zfstat image
Create mask. For details see fslmaths:
fslmaths ../flameo/stats/zstat1.nii.gz
         -mas merge_mask.nii.gz
         zstat1_mask.nii.gz

arguments
-mas   : use (following image>0) to mask current image
Copy Geometry image dimensions, voxel dimensions, voxel dimensions units string, image orientation/origin or qform/sform info) from one image to another:
fslcpgeom MNI152_T1_2mm_brain.nii.gz zstat1_mask.nii.gz
Cluster based thresholding. For details see FEAT:
cluster --dlh = 0.0023683100
        --in = zstat1_mask.nii.gz
        --oindex = zstat1_cluster_index.nii.gz
        --olmax = zstat1_cluster_localmax.txt
        --othresh = zstat1_cluster_threshold.nii.gz
        --pthresh = 0.0500000000
        --thresh = 2.3000000000
        --volume = 197071

arguments
--in    :    filename of input volume
--dlh   :    smoothness estimate = sqrt(det(Lambda))
--oindex  :  filename for output of cluster index
--othresh :  filename for output of thresholded image
--olmax   :  filename for output of local maxima text file
--volume  :  number of voxels in the mask
--pthresh :  p-threshold for clusters
--thresh  :  threshold for input volume
Z statistic image is thresholded to show which voxels or clusters of voxels are activated at a particular significance level. A Z statistic threshold is used to define contiguous clusters. Then each cluster’s estimated significance level (from GRF-theory) is compared with the cluster probability threshold. Significant clusters are then used to mask the original Z statistic image.
Get the maximum intensity value of the output thresholded image. This used is while rendering the Z statistic image:
fslstats zstat1_cluster_threshold.nii.gz -R

arguments
-R  : output <min intensity> <max intensity>
Rendering. For details see FEAT:
overlay 1 0 MNI152_T1_2mm_brain.nii.gz
       -a zstat1_cluster_threshold.nii.gz
       2.30 15.67
       zstat1_cluster_threshold_overlay.nii.gz

slicer zstat1_cluster_threshold_overlay.nii.gz
       -L  -A 750
       zstat1_cluster_threshold_overlay.png
The Z statistic range selected for rendering is automatically calculated by default, to run from red (minimum Z statistic after thresholding) to yellow (maximum Z statistic, here maximum intensity).
High Level Workflow Graph:
Detailed Workflow Graph:

Examples
>>> from CPAC.easy_thresh import easy_thresh
>>> preproc = easy_thresh("new_workflow")
>>> preproc.inputs.inputspec.z_stats= 'flameo/stats/zstat1.nii.gz'
>>> preproc.inputs.inputspec.merge_mask = 'merge_mask/alff_Z_fn2standard_merged_mask.nii.gz'
>>> preproc.inputs.inputspec.z_threshold = 2.3
>>> preproc.inputs.inputspec.p_threshold = 0.05
>>> preproc.inputs.inputspec.parameters = ('/usr/local/fsl/', 'MNI152')
>>> preporc.run()
- CPAC.easy_thresh.get_standard_background_img(in_file, file_parameters)[source]
Method to get the standard brain image from FSL standard data directory
- Parameters:
- in_filenifti file
Merged 4D Zmap volume
- file_parameterstuple
Value FSLDIR and MNI from config file
- Returns:
- standard_pathstring
Standard FSL Image file path
- Raises:
- Exception
If nibabel cannot load the input nifti volume
- CPAC.easy_thresh.get_tuple(infile_a, infile_b)[source]
Simple method to return tuple of z_threhsold maximum intensity values of Zstatistic image for input to the overlay.
- Parameters:
- z_thesholdfloat
z threshold value
- intensity_stattuple of float values
minimum and maximum intensity values
- Returns:
- img_min_maxtuple (float)
tuple of zthreshold and maximum intensity value of z statistic image