Network Centrality
Introduction & Background
Nodes are the basic units of a network, and are connected by edges. Among the many nodes that form the whole-brain network (also known as the functional connectome), some play a crucial role and may be considered central within the network. These central nodes can be identified by applying various graph-theory based network analysis techniques which provide a measure of the centrality or functional importance of each node (Koschutzki et al. 2005). Different centrality measures capture different aspects of connectivity (Joyce et al., 2010; Zuo et al., 2011). CPAC is able to calculate three commonly used centrality indices: Degree Centrality (DC), Eigenvector Centrality (EC), and local Functional Connectivity Density (lFCD). Unlike traditional functional connectivity analyses, centrality measures capture the complexity of the entire functional connectome, and do not require the selection of any a priori regions of interest.
Degree centrality is a measure of local network connectivity and identifies the most connected nodes by counting the number of direct connections (edges) to all other nodes. As such, a node with high DC will have direct connections to many other nodes in the network. Degree centrality analysis tends to emphasize higher order cortical association areas while showing reduced sensitivity for paralimbic and subcortical regions (Zuo et al., 2012).
Eigenvector centrality is a measure of global network connectivity. The EC of a given node reflects the number of direct connections it has with other nodes that have high centrality. Thus, the EC of a given node depends not only on its own centrality, but the centrality of the nodes it connects to. A node with high EC has connections to many other nodes that are themselves highly connected and central within the network. In contrast to DC, EC is more sensitive to paralimbic and subcortical regions (Zuo et al., 2012).
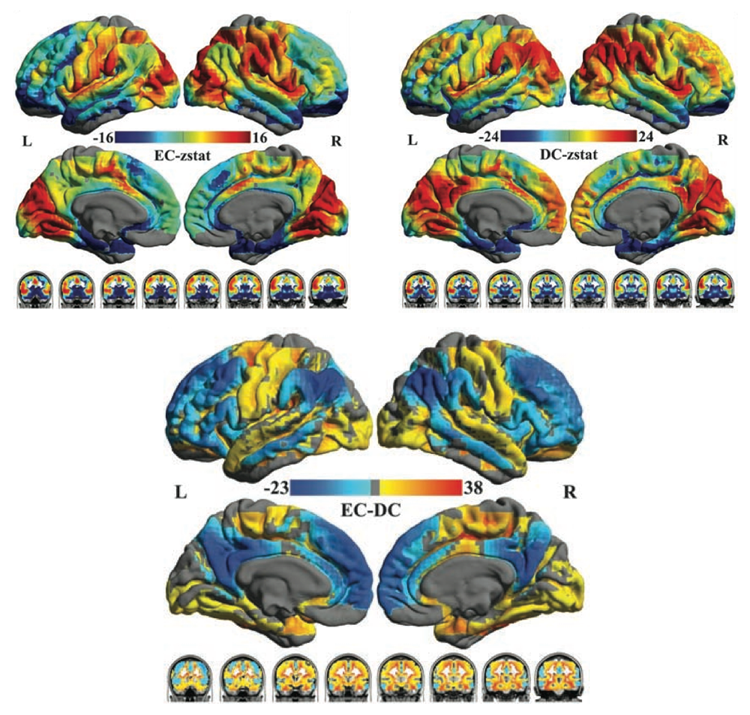
The figure below (taken from Zuo et al., 2012) shows differences in centrality across the brain, as well as differences between EC and DC measures.
Local Functional Connectivity Density is another measure of local network connectivity. A given seed must be a voxel-based mask, unlike DC and EC which can be calculated for ROIs. lFCD mapping finds the given seed’s neighbors and neighbor’s neighbors until edges become weaker than the given threshold value. This measure was first implemented as FCDM by Tomasi and Volkow (2010)
Computation and Analysis Considerations
For each subject, the timeseries for each node is extracted and used to calculate a temporal correlation matrix which represents the connectivity between all nodes. A threshold is then applied to the correlation matrix to create an adjacency matrix which describes all nodes that have survived thresholding. In CPAC, users can choose to apply a threshold based on either sparsity, significance, or correlation strength. Threshold values should be chosen carefully, as they can strongly influence the results of centrality analysis (Zuo et al., 2012).
Of the three centrality measures computed by CPAC, Degree Centrality is the simplest, and is computed by counting the number of significant correlations between the timeseries of a given node and that of all other nodes in the adjacency matrix. Local Functional Connectivity Density should be faster because it only calculates neighboring connections which have weights above the threshold. On the other hand, Eigenvector Centrality is computed by identifying the first eigenvector of the adjacency matrix, which corresponds to the largest eigenvalue. Since EC is a recursive measure that takes into account the properties of connected nodes, the EC of a given node is proportional to the sum of the EC of all directly neighboring nodes. After computing the centrality measures, centrality maps are generated and standardized using Z-scores for use in group analysis (Zuo et al., 2012). For more detail on how CPAC computes these steps, please see the Network Centrality Page of the developer documentation.
Applications and Recommendations
Degree centrality has been widely used to identify “functional hubs” and examine node characteristics of intrinsic connectivity networks (Buckner et al. 2009; Bullmore and Sporns 2009; He et al. 2009; Wang et al. 2010; Fransson et al. 2011). Centrality measures have also been used to show that the topology of these hub structures changes with age. Specifically, cortical hubs are largely confined to primary sensory and motor areas in infants (Fransson et al. 2011), but are localized to heteromodal higher-order association regions in adults (Buckner et al. 2009).
Beyond detecting functional hubs, both DC and EC have been used as a way of characterizing information flow through the functional connectome at the voxel level. These voxel-wise centrality analyses (depicted in the figure above, taken from Zuo et al., 2012) showed both short and long-term test-retest reliability, and appear to be modulated by age and sex (Zuo et al., 2012). Additionally, EC has been shown to be modulated by subjects’ states of hunger or satiety (Lohmann et al. 2010).
Configuring C-PAC to Run Network Centrality
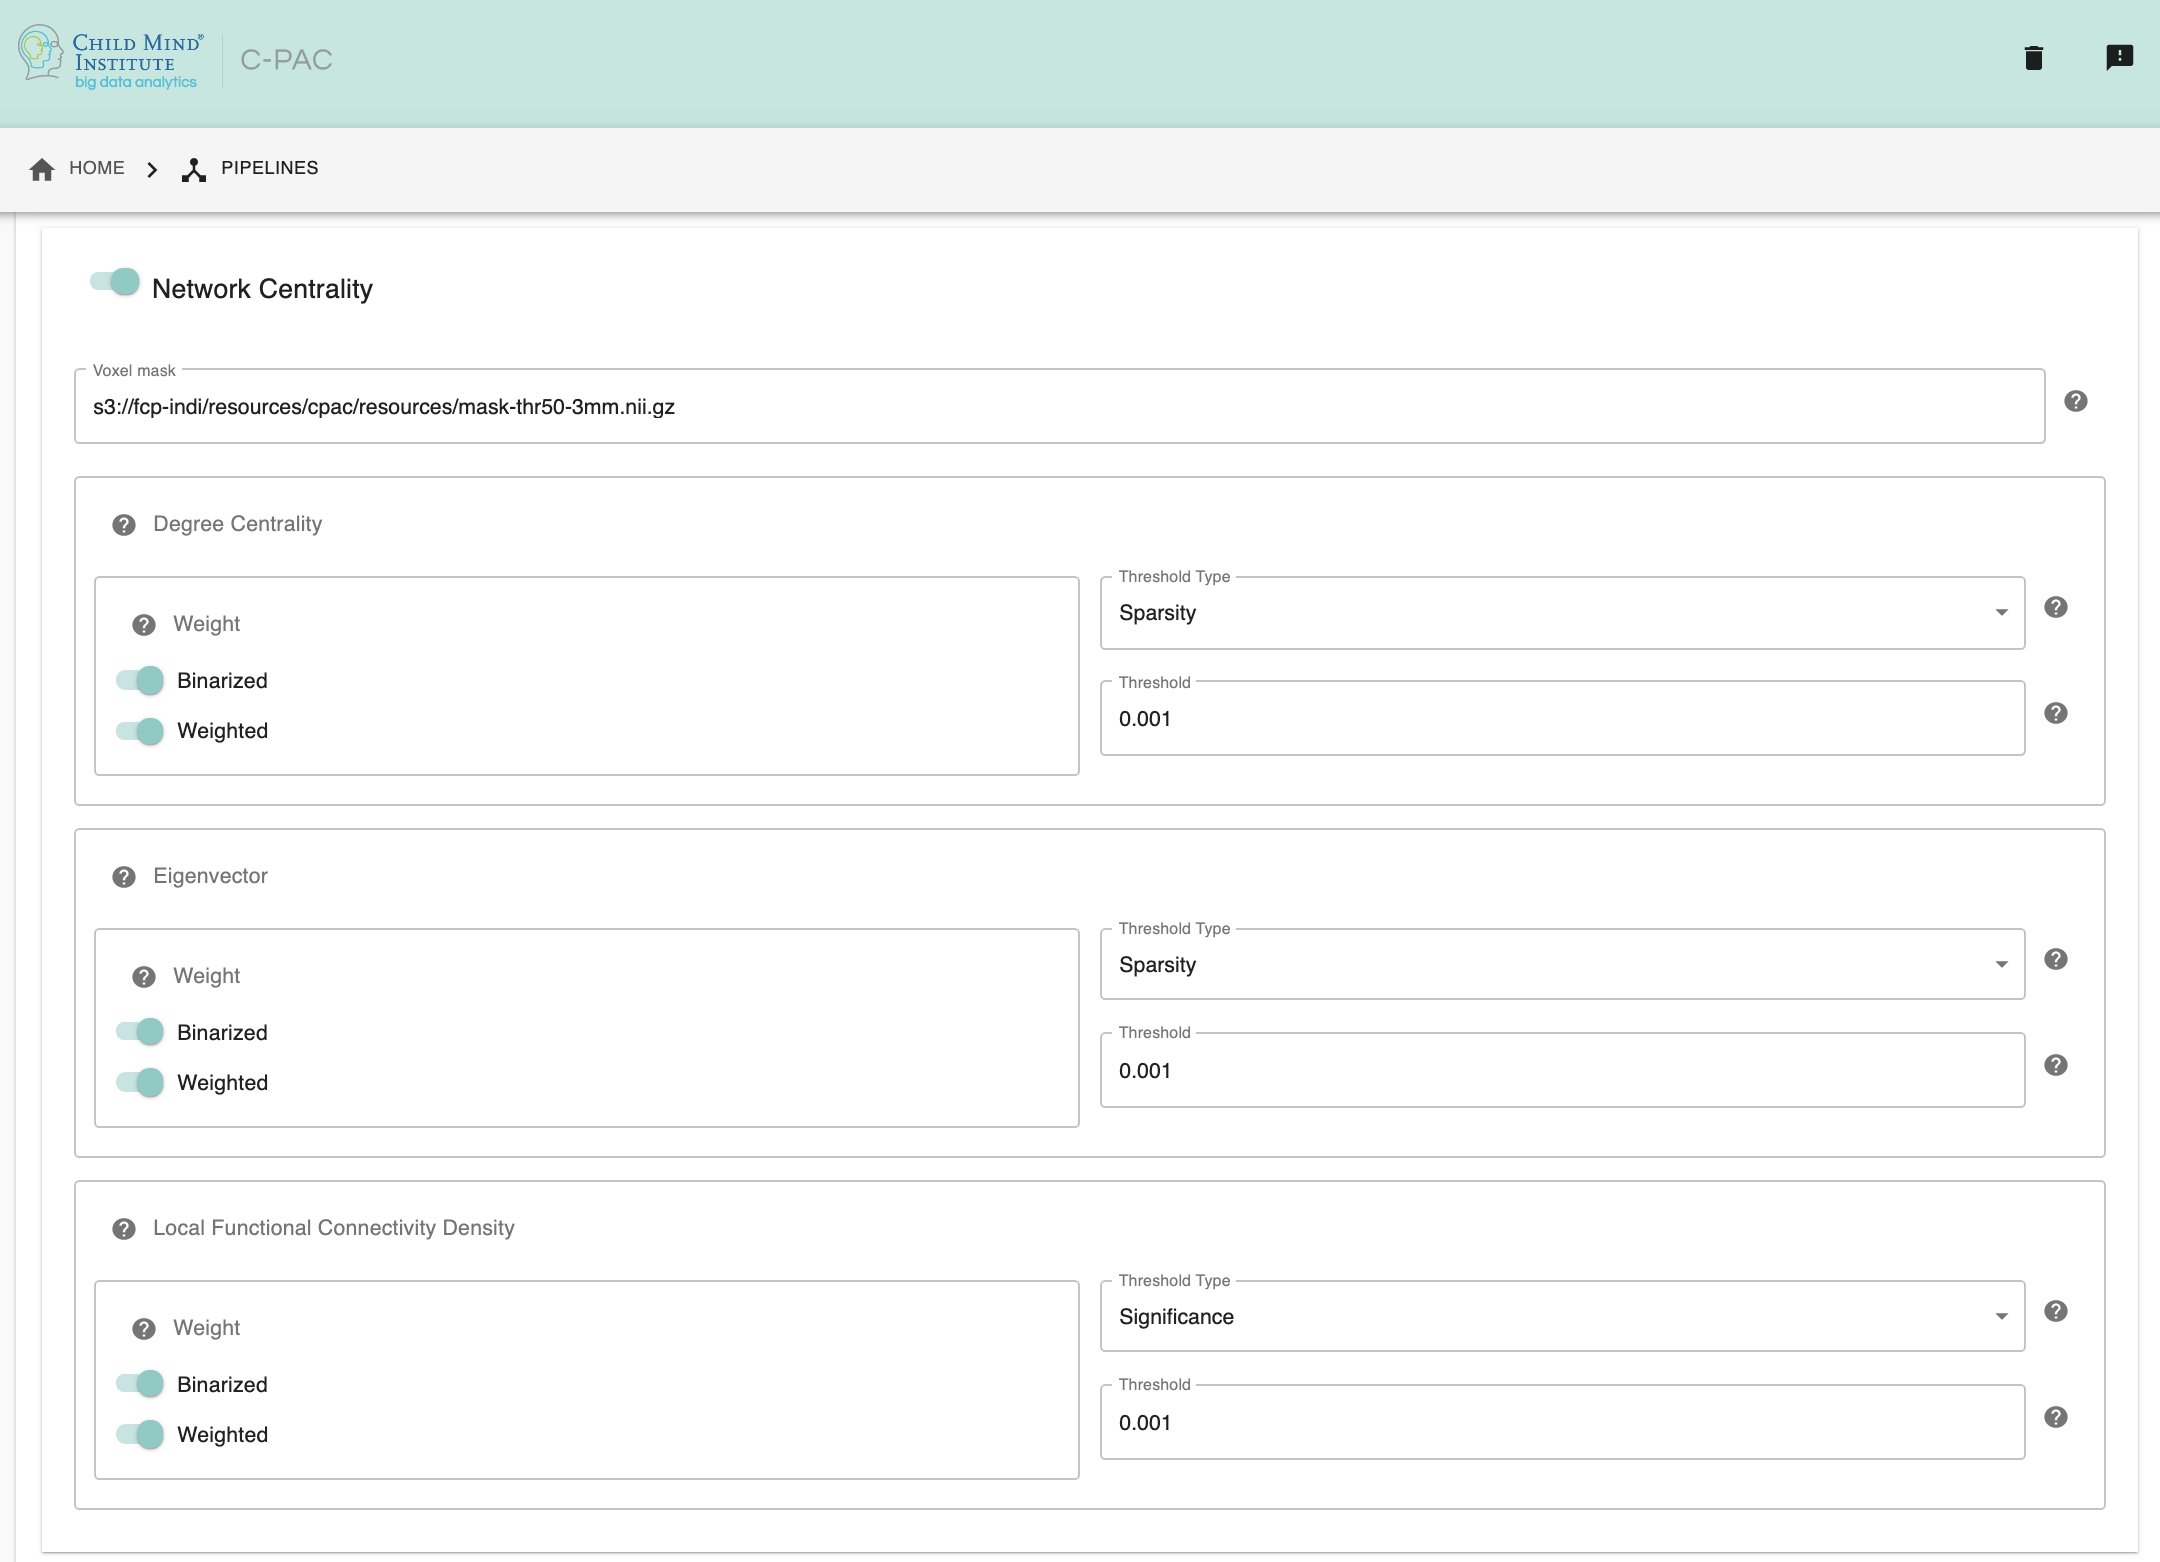
Network Centrality - [On, Off]: Calculate Degree Centrality and/or Eigenvector Centrality and/or Local Functional Connectivity Density. Note that calculating Eigenvector Centrality will take significantly longer and require significantly more computing power to calculate than Degree Centrality.
Voxel mask - [path]: Full path to a text file containing a mask or list of ROIs. Each line of this file should contain the path to an ROI or mask. If a mask is specified, centrality will be calculated for all voxels within the mask. If a list of ROIs is specified, each ROI will be treated as a node, and centrality will be calculated for each node.
Degree Centrality Weight Options - [Binarized(On, Off), Weighted(On, Off)]: Specify how connections are represented during graph construction for degree centrality. Binarized: Connection strength is either 1 or 0. Weighted: Connection strength is a correlation value.
Degree Centrality Threshold Type - [Significance, Sparsity, Correlation]: Select the type of threshold used when creating the adjacency matrix for degree centrality.
Degree Centrality Threshold Value - [decimal]: Based on the Threshold Type selected above, enter a Threshold Value. P-value for Significance Threshold, Sparsity value for Sparsity Threshold, Pearson’s r value for Correlation Threshold.
Eigenvector Centrality Weight Options - [Binarized(On, Off), Weighted(On, Off)]: Specify how connections are represented during graph construction for eigenvector centrality. Binarized: Connection strength is either 1 or 0. Weighted: Connection strength is a correlation value.
Eigenvector Centrality Threshold Type - [Significance, Sparsity, Correlation]: Select the type of threshold used when creating the adjacency matrix for eigenvector centrality.
Eigenvector Centrality Threshold Value - [decimal]: Based on the Threshold Type selected above, enter a Threshold Value. P-value for Significance Threshold, Sparsity value for Sparsity Threshold, Pearson’s r value for Correlation Threshold.
Local Functional Connectivity Density Weight Options - [Binarized(On, Off), Weighted(On, Off)]: Specify how connections are represented during graph construction for LFCD. Binarized: Connection strength is either 1 or 0. Weighted: Connection strength is a correlation value.
Local Functional Connectivity Density Threshold Type - [Significance, Sparsity, Correlation]: Select the type of threshold used when creating the adjacency matrix for LFCD.
Local Functional Connectivity Density Threshold Value - [decimal]: Based on the Threshold Type selected above, enter a Threshold Value. P-value for Significance Threshold, Sparsity value for Sparsity Threshold, Pearson’s r value for Correlation Threshold.
Note that only centrality measures that have binarized/weighted checked on this screen will be run.
Configuration Without the GUI
The following nested key/value pairs will be set to these defaults if not defined in your pipeline configuration YAML.
network_centrality:

  # Calculate Degree, Eigenvector Centrality, or Functional Connectivity Density.
  run: On

  # Maximum amount of RAM (in GB) to be used when calculating Degree Centrality.
  # Calculating Eigenvector Centrality will require additional memory based on the size of the mask or number of ROI nodes.
  memory_allocation:  1.0

  # Full path to a NIFTI file describing the mask. Centrality will be calculated for all voxels within the mask.
  template_specification_file:  /cpac_templates/Mask_ABIDE_85Percent_GM.nii.gz

  degree_centrality:

    # Enable/Disable degree centrality by selecting the connectivity weights
    #   weight_options: ['Binarized', 'Weighted']
    # disable this type of centrality with:
    #   weight_options: []
    weight_options:  ['Binarized', 'Weighted']

    # Select the type of threshold used when creating the degree centrality adjacency matrix.
    # options:
    #   'Significance threshold', 'Sparsity threshold', 'Correlation threshold'
    correlation_threshold_option: 'Sparsity threshold'

    # Based on the Threshold Type selected above, enter a Threshold Value.
    # P-value for Significance Threshold
    # Sparsity value for Sparsity Threshold
    # Pearson's r value for Correlation Threshold
    correlation_threshold: 0.001

  eigenvector_centrality:

    # Enable/Disable eigenvector centrality by selecting the connectivity weights
    #   weight_options: ['Binarized', 'Weighted']
    # disable this type of centrality with:
    #   weight_options: []
    weight_options: ['Weighted']

    # Select the type of threshold used when creating the eigenvector centrality adjacency matrix.
    # options:
    #   'Significance threshold', 'Sparsity threshold', 'Correlation threshold'
    correlation_threshold_option: 'Sparsity threshold'

    # Based on the Threshold Type selected above, enter a Threshold Value.
    # P-value for Significance Threshold
    # Sparsity value for Sparsity Threshold
    # Pearson's r value for Correlation Threshold
    correlation_threshold: 0.001

  local_functional_connectivity_density:

    # Enable/Disable lFCD by selecting the connectivity weights
    #   weight_options: ['Binarized', 'Weighted']
    # disable this type of centrality with:
    #   weight_options: []
    weight_options: ['Binarized', 'Weighted']

    # Select the type of threshold used when creating the lFCD adjacency matrix.
    # options:
    #   'Significance threshold', 'Correlation threshold'
    correlation_threshold_option: 'Correlation threshold'

    # Based on the Threshold Type selected above, enter a Threshold Value.
    # P-value for Significance Threshold
    # Sparsity value for Sparsity Threshold
    # Pearson's r value for Correlation Threshold
    correlation_threshold: 0.6
References
Buckner RL, Sepulcre J, Talukdar T, Krienen FM, Liu H, Hedden T, Andrews-Hanna JR, Sperling RA, Johnson KA. 2009. Cortical hubs revealed by intrinsic functional connectivity: mapping, assessment of stability, and relation to Alzheimer’s disease. J Neurosci. 29:1860–1873.
Bullmore E, Sporns O. 2009. Complex brain networks: graph theoretical analysis of structural and functional systems. Nat Rev Neurosci. 10:186–198.
Fransson P, Aden U, Blennow M, Lagercrantz H. 2011. The functional architecture of the infant brain as revealed by resting-state fMRI. Cereb Cortex. 21:145–154.
Joyce KE, Laurienti PJ, Burdette JH, Hayasaka S. 2010. A new measure of centrality for brain networks. PLoS One. 5:e12200.
He Y, Wang J, Wang L, Chen ZJ, Yan C, Yang H, Tang H, Zhu C, Gong Q, Zang Y, et al. 2009. Uncovering intrinsic modular organization of spontaneous brain activity in humans. PLoS One. 4:e5226.
Koschu tzki D, Lehmann KA, Peeters L, Richter S, Tenfelde-Podehl D, Zlotowski O. 2005. Centrality indices. In: Brandes U, Erlebach T, editors. Network analysis: methodological foundations. New York: Springer-Verlag. p. 16–61.
Lohmann G, Margulies DS, Horstmann A, Pleger B, Lepsien J, Goldhahn D, Schloegl H, Stumvoll M, Villringer A, Turner R. 2010. Eigenvector centrality mapping for analyzing connectivity patterns in fMRI data of the human brain. PLoS One. 5:e10232
Tomasi D, Volkow ND. 2010. Functional connectivity density mapping. PNAS. 107(21):9885-9890.
Wang J, Zuo X, He Y. 2010. Graph-based network analysis of restingstate functional MRI. Front Syst Neurosci. 4:16.
Zuo XN, Ehmke R, Mennes M, Imperati D, Castellanos X, Sporns O, Milham MP. 2012. Network centrality in the human functional connectome. Cerebral cortex. 22:1862-1875.