Multivariate Distance Matrix Regression (MDMR)
Introduction & Background
Connectome-wide Association Studies (CWAS) allow researchers to explore relationships between patterns of functional connectivity (the functional connectome), behavior, and phenotypic factors. The CWAS method that is implemented in C-PAC (Shehzad et al., 2014) examines the correlation among patterns of functional connectivity and phenotypes using the Multivariate Distance Matrix Regression (MDMR; Reiss et al., 2010). Compared to traditional univariate techniques which require rigorous correction for multiple comparisons, a multivariate approach significantly reduces the number of connectivity-phenotype comparisons needed to run a CWAS (Shehzad et al., 2014).
Computation and Analysis Considerations
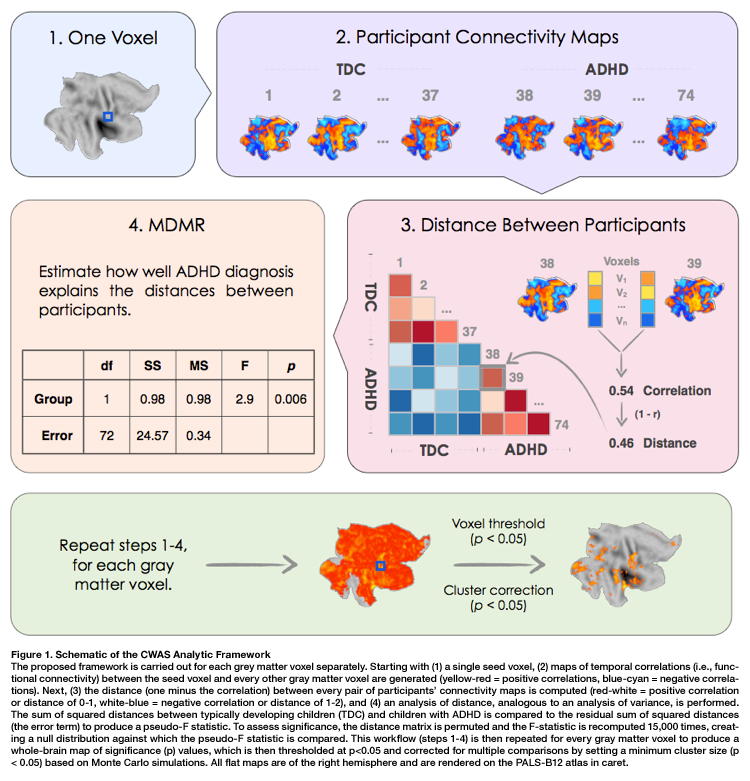
Computation steps for CWAS are listed below as described by Shehzad and colleagues (2014).
For each subject, C-PAC computes the correlation of BOLD signals between every possible pair of gray matter voxels, resulting in a V x V correlation matrix for each subject (where V is the number of gray matter voxels).
To determine individual differences, patterns of whole-brain connectivity for each voxel are compared to the connectivity pattern for the same voxel between all possible pairs of subjects. A distance matrix is then computed which represents the dissimilarity between whole-brain connectivity patterns for any pair of subjects.
MDMR is then used to test whether, for each voxel, whole-brain connectivity patterns tend to be more similar for individuals with like phenotypes (within-group) than individuals with unlike phenotypes (between-group). This quantifies how well phenotypic variables explain the distances between participants in the distance matrix.
The significance of these similarities and differences is assessed with a permutation test. This identifies brain regions whose whole-brain pattern of connectivity is significantly predicted by a particular phenotypic variable.
The figure below (taken from Shehzad et al., 2010) outlines these steps. For more detail on how C-PAC handles these computations, please see the CWAS section of the developer documentation.
It is important to note that the results of MDMR analysis do not contain information about the direction of connectivity-phenotype relationships, nor the specific connections underlying these connectome-wide associations. Follow-up analysis using seed-based correlation analysis (or similar methods) is required to discover this information (Shehzad et al., 2014). To avoid bias caused by ‘double-dipping’ your data (Kriegeskorte et al., 2009), this analysis should always be performed on an independent sample (Shehzad et al., 2014). Further, the results of these follow-up analyses should take into account existing knowledge about brain anatomy and physiology before being considered definitive (Shehzad et al., 2014).
Applications and Recommendations
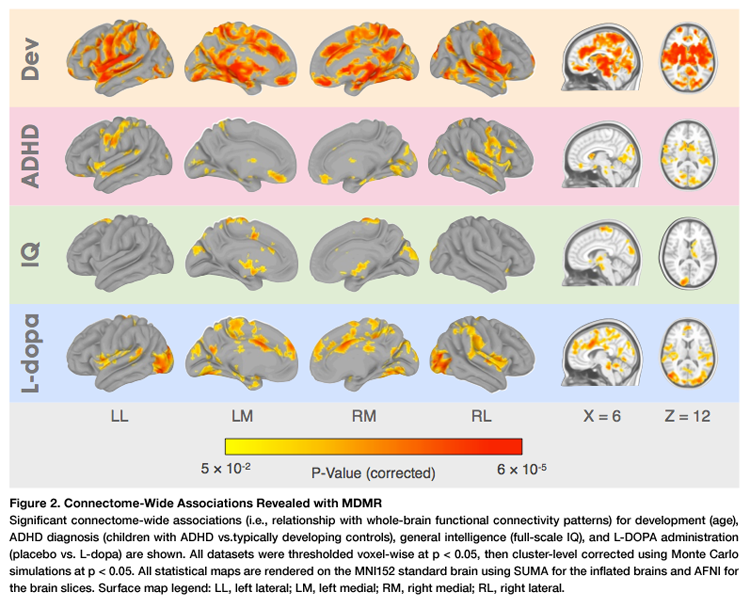
As C-PAC is one of the first public software packages to implement CWAS, it has yet to be utilized by more than a few researchers. The most notable use to date is the analysis performed by Shehzad and colleagues, who found robust associations between functional connectivity and a number of phenotypic characteristics including age, ADHD diagnosis, IQ, and L-dopa administration.
As CWAS examines connectivity across the whole brain, it may have reduced sensitivity to highly-localized sets of connections related to a phenotype. This issue can be addressed by limiting analysis to connectivity between specific anatomical regions (Shehzad et al., 2014), which can be accomplished by defining an ROI mask during C-PAC setup.
Configuring CWAS
Configuration Using a YAML File
To configure CWAS options within a YAML file, add the following lines to your file (with appropriate substitutions for paths):
# Multivariate Distance Matrix Regression (MDMR)
mdmr:

  # Used to determine if Multivariate Distance Matrix Regression (MDMR) will be added to the pipeline or not.
  run:  [0]

  # Inclusion list text file listing the participant IDs you wish to include in the MDMR analysis. If left as None, will include all subjects.
  inclusion_list : None

  # Path to a mask file. Voxels outside of the mask will be excluded from MDMR.
  roi_file: /path

  # Path to a CSV file containing the phenotypic regressor.
  regressor_file:

  # Name of the participants column in your regressor file.
  regressor_participant_column: ''

  # Columns from the CSV file indicating factor variables. Other columns will be handled as covariates. Separated by commas.
  regressor_columns: ''

  # Number of permutation tests to run on the Pseudo-F statistics.
  permutations:  15000

  # Number of Nipype nodes created while computing MDMR. Dependent upon computing resources.
  parallel_nodes:  10

  # If you want to create zstat maps
  zscore: [1]
References
Reiss, P.T., Stevens, M.H.H., Shehzad, Z., Petkova, E. & Milham, M.P. On distance-based permutation tests for between-group comparisons. Biometrics 66, 636–643 (2010).
Shehzad, Z., Kelly, C., Reiss, P.T., Craddock, C.R., Emerson, J.W., McMahon, K., Copland, D.A., Castellanos, F.X., & Milham, M.P. An Analytic Framework for Connectome-Wide Association Studies. Neuroimage, 93 Pt 1, 74–94 (2014).
Kriegeskorte, N., Simmons, W.K., Bellgowan, P.S.F. & Baker, C.I. Circular analysis in systems neuroscience: the dangers of double dipping. Nat Neurosci 12, 535–540 (2009)