Visual Data Quality Control Interface
C-PAC’s data quality control (QC) interface allows you to take a quick glance at the overall quality of your results (registration quality, signal-to-noise ratio, movement plots, computed derivative histograms, etc.). In its current form, the QC interface is a collection of HTML pages - one for each participant-scan-nuisance regression strategy combination, and they can be found in the Output Directory under each participant’s directory level.
Upcoming Additions
In future releases, more visualizations will be introduced, and the QC pages will be integrated into an easy-to-use dashboard that is updated throughout the process of your C-PAC run, and also provides information on the status of the pipeline. As always, we greatly appreciate any ideas, suggestions, or items on your wishlist and take them into consideration.
Quick Look
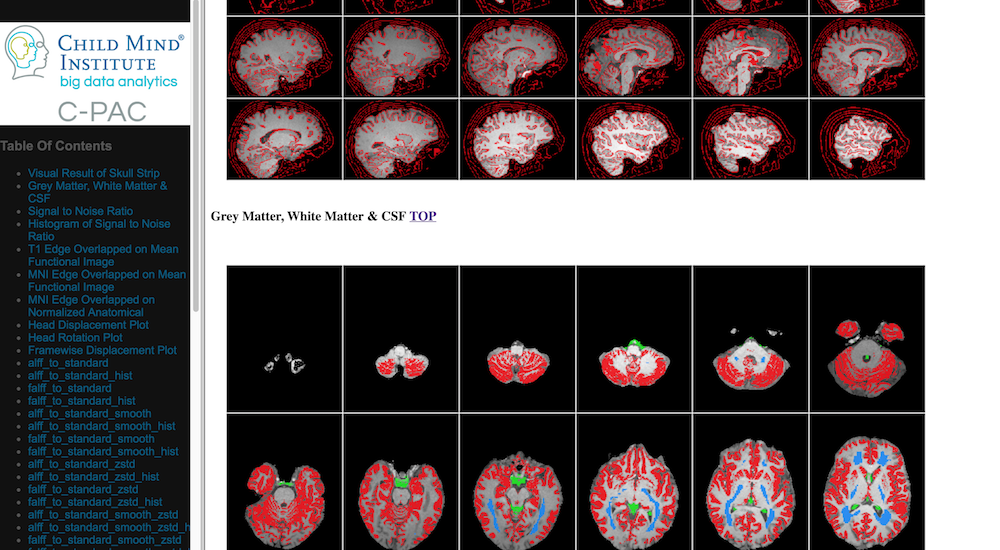
Skull-stripping and Segmentation Quality
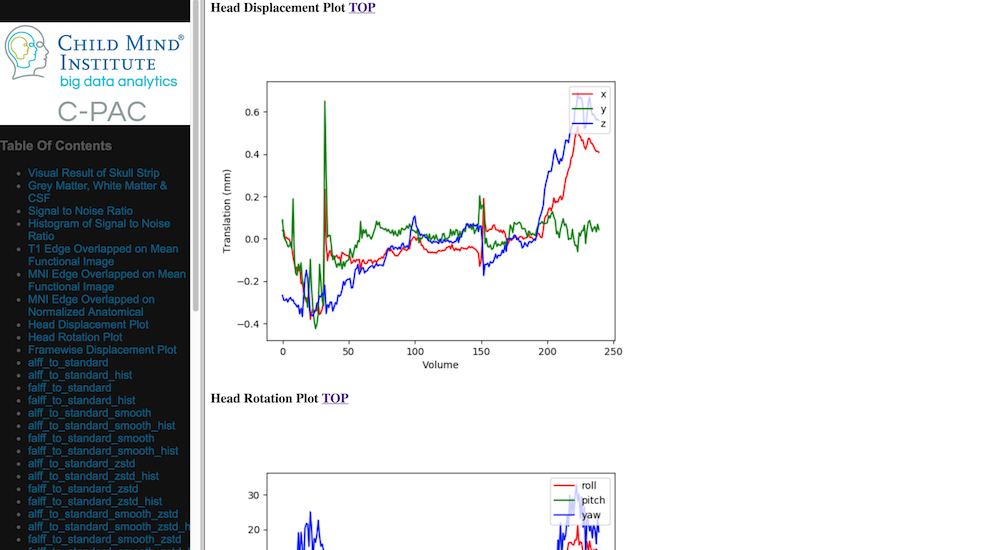
Head Movement Measures
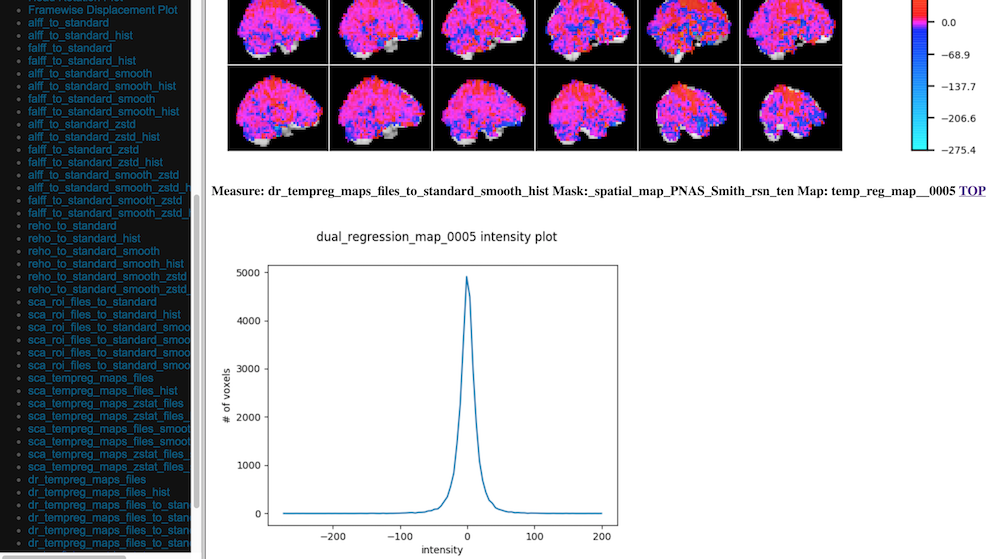
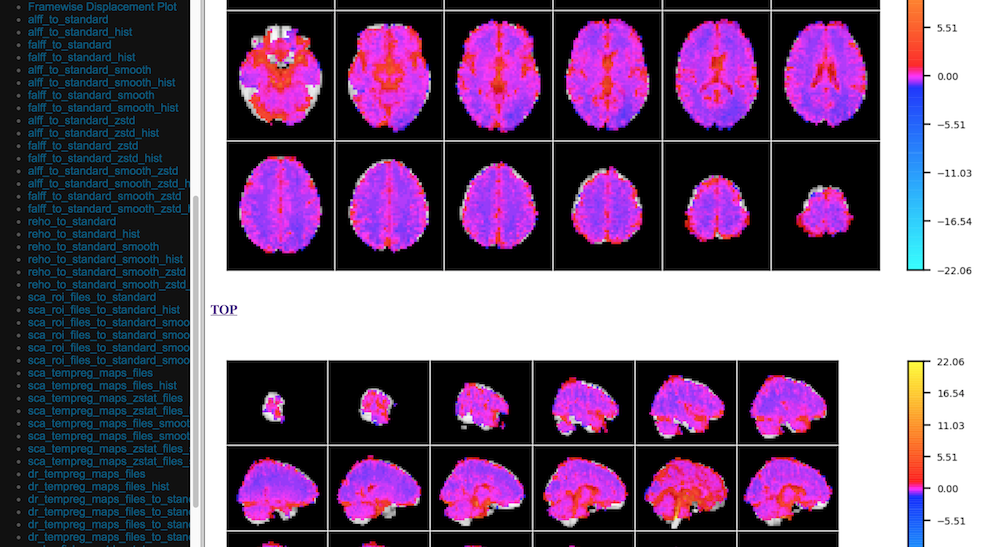
Quick View of Derivatives
With Histograms